Details
-
Type:
New Feature
-
Status: Open
-
Priority:
 Major
Major
-
Resolution: Unresolved
-
Affects Version/s: None
-
Fix Version/s: None
-
Component/s: gui design issue, Properties and Preferences, renderer
-
Labels:
Description
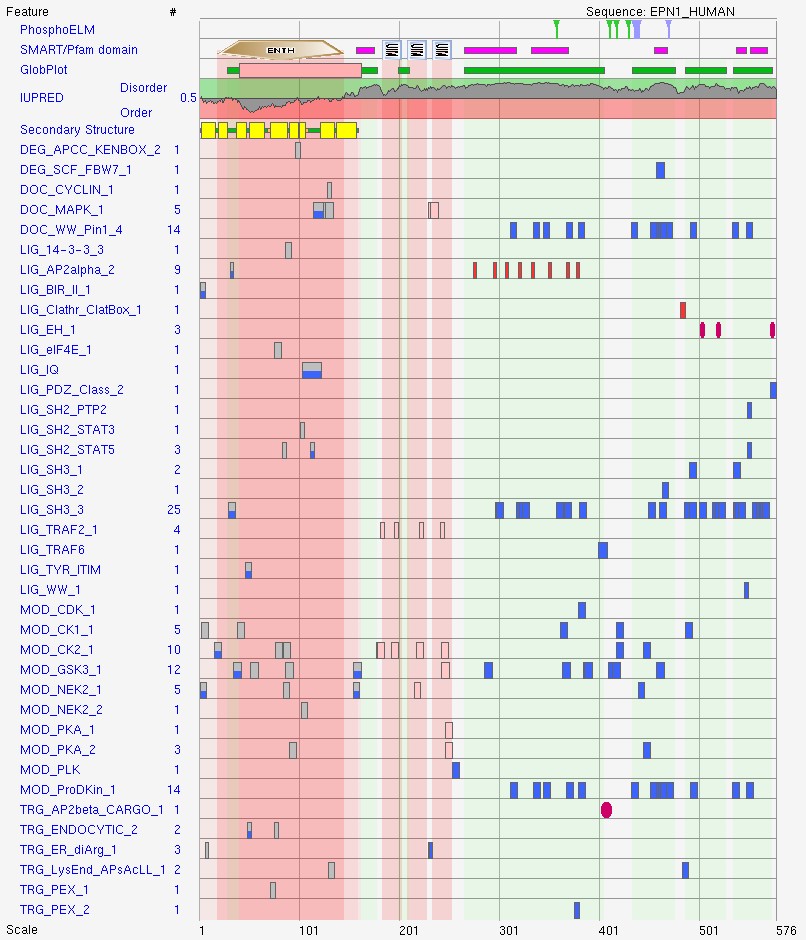
Line graphs shown under the alignment could be more legible if the area is shaded. This is particularly useful when interpreting variation relative to a particular threshold, since shading can be used to distinguish regions above or below the threshold.
ELM provides a good example of how shading can be used to highlight disordered regions.
ELM provides a good example of how shading can be used to highlight disordered regions.